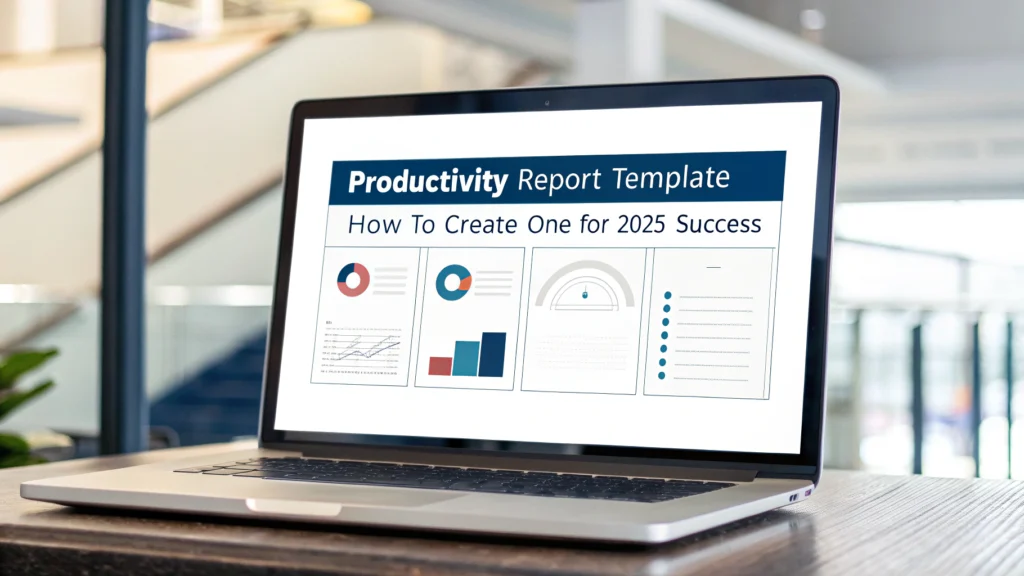
Productivity Report Template: How to Create One for 2025 Success
Tracking productivity isn't just about watching numbers—it's about knowing exactly where your business stands and where it can go. A >productivity report template changes everything by giving you the framework to capture, analyze, and act on your team's performance data.
I've seen companies transform their entire operation by implementing the right >productivity report 2025 approach. Let's dive into how you can create one that actually drives results.
Why You Need a Productivity Report in 2025
The business landscape is changing faster than ever. Companies leveraging data-driven decisions through >business productivity reports consistently outperform competitors.
Here's why productivity reports matter more than ever:
- They reveal hidden inefficiencies costing you money
- They spotlight your top performers (and underperformers)
- They provide concrete data for strategic decisions
- They create accountability across your organization
In my experience working with growing businesses, implementing even a basic >productivity tracking template can boost overall output by 15-30% within months.
Key Elements of an Effective Productivity Report Template
Creating a truly useful >productivity report format isn't as simple as tracking hours worked. Your template should include these critical components:
1. Clear KPIs and Metrics
Every effective report starts with the right metrics:
- Output metrics (tasks completed, sales made, etc.)
- Quality metrics (error rates, customer satisfaction)
- Efficiency metrics (time per task, resource utilization)
- Outcome metrics (revenue generated, cost savings)
Pro tip: Don't track everything. Pick 3-5 metrics that truly matter for each role or department.
2. Time Period Comparison
Your >productivity report template should include:
- Current period data (daily, weekly, monthly)
- Previous period comparison
- Year-over-year comparison when applicable
- Progress toward quarterly/annual goals
This provides context that single-period snapshots can't offer.
3. Visual Data Representation
Numbers alone don't tell the story. Your template should include:
- Clear charts showing trends
- Color-coded indicators (red, yellow, green)
- Comparison visualizations (this month vs. last month)
- Progress bars toward targets

4. Individual and Team Breakdowns
Effective >employee productivity report templates include:
- Individual performance metrics
- Team/department summaries
- Company-wide productivity indicators
- Benchmark comparisons where available
Looking for a productivity boost? Check out the >AI for Productivity eBook + Checklist: Supercharge Your Efficiency in 2025 to take your performance to the next level.
How to Create a Productivity Report Step-by-Step
Let's break down exactly >how to create a productivity report that actually gets results:
Step 1: Define Your Productivity Goals
Start by answering:
- What specific outcomes matter most to your business?
- What behaviors drive those outcomes?
- How will you measure progress?
Example: If you're a software development team, you might track story points completed, bug fix rates, and deployment frequency.
Step 2: Choose Your Data Collection Methods
Options include:
- Time tracking software
- Project management platforms
- CRM data for sales teams
- Manual input (though this is less reliable)
The best systems automate data collection as much as possible.
Step 3: Design Your Template Structure
Your template should include:
- An executive summary section
- Individual/team performance sections
- Trend analysis
- Areas for improvement
- Action items and next steps
Step 4: Create Visualization Components
Add these visual elements:
- Line charts for trends
- Bar charts for comparisons
- Heat maps for identifying patterns
- Gauges for goal progress
Step 5: Set Up Automated Data Integration
Connect your >productivity tracking template to your data sources:
- Use API connections when possible
- Set up regular data refresh intervals
- Create alert thresholds for unusual changes
Step 6: Implement Reporting Cadence
Determine your reporting frequency:
- Daily reports for fast-moving metrics
- Weekly reports for team performance
- Monthly reports for trend analysis
- Quarterly reports for strategic review
If you struggle with focus and organization, the >ADHD Productivity Power Pack: Ebooks, Guides, Checklists, Workbook & Tools to Master Focus, Time Management & Organization can help you create and maintain productivity systems that work for your brain.
Productivity Report Template Examples by Department
Different teams need different productivity measures. Here are tailored approaches:
Sales Team Productivity Template
Key metrics to include:
- Calls/meetings per rep per day
- Conversion rates at each pipeline stage
- Average deal size and cycle time
- Revenue per rep against targets
Customer Service Productivity Template
Focus on:
- Tickets resolved per agent
- Average resolution time
- First contact resolution rate
- Customer satisfaction scores
Marketing Team Productivity Template
Track these elements:
- Campaign completion rates
- Asset production metrics
- Lead generation numbers
- Channel performance metrics
Manufacturing Productivity Template
Monitor:
- Units produced per hour/shift
- Equipment utilization rates
- Quality control metrics
- Downtime analysis
Common Productivity Report Mistakes to Avoid
I've seen companies make these productivity reporting errors repeatedly:
- Tracking too many metrics – Focus on vital few vs. trivial many
- No clear actions – Reports should drive specific improvements
- Inconsistent measurement – Changing methodology breaks trends
- Analysis paralysis – Don't let perfect reporting prevent action
- Missing context – Numbers without context lead to wrong conclusions
How to Use AI to Supercharge Your Productivity Reports in 2025
AI transforms how we create and use >productivity report templates:
- Automated data cleaning and preparation
- Pattern recognition in productivity fluctuations
- Predictive analytics for future performance
- Natural language summaries of complex data
- Personalized insight generation
Want to leverage AI for productivity? Check out the >AI for Productivity eBook + Checklist: Supercharge Your Efficiency in 2025 for implementation guidance.
Implementing Your Productivity Report System
Getting your team on board with a new productivity reporting system requires:
- Clear communication about why metrics matter
- Training on how to interpret reports
- Gradual rollout to allow adjustment
- Feedback loops to improve the system
- Visible actions based on report insights
Remember: successful productivity reporting creates a culture of continuous improvement, not fear.
Your 2025 Productivity Report Success Checklist
Use this checklist to ensure your >productivity report 2025 system succeeds:
- Clearly defined business objectives
- Relevant KPIs directly tied to outcomes
- User-friendly reporting template
- Automated data collection
- Regular review cadence established
- Action items generated from each report
- Continuous refinement process
- Team trained on report interpretation
- Executive sponsorship secured
Conclusion
Creating an effective >productivity report template isn't just about tracking work—it's about transforming how your business operates. When done right, productivity reporting becomes the compass that guides your company toward greater efficiency, higher output, and ultimately, better results.
The most successful organizations in 2025 won't just be working hard—they'll be working smart with data-driven productivity systems. Start building yours today.
Ready to take your productivity tracking to the next level? Download our >AI for Productivity eBook + Checklist: Supercharge Your Efficiency in 2025 and transform how you measure, track, and improve performance.
FAQs About Productivity Report Templates
How often should I generate productivity reports?
Different metrics require different frequencies. Daily reports work best for immediate metrics like calls made or tasks completed. Weekly reports help identify short-term trends. Monthly and quarterly reports provide the big picture for strategic decisions.
What's the difference between productivity and efficiency reports?
Productivity typically measures output quantity (how much gets done), while efficiency measures the resources required to achieve that output (how well it gets done). A complete >productivity report format should include both.
How can small businesses implement productivity reporting with limited resources?
Start simple with spreadsheet templates and free or low-cost tools like Google Sheets, Trello, or Asana. Focus on just 2-3 core metrics that directly impact revenue or customer satisfaction, then expand as you grow.
Should employee productivity reports be shared with the entire team?
Transparency generally improves performance, but consider your company culture. Many organizations share team-level data openly while keeping individual metrics private between employees and managers. The key is consistency and clarity about how the data will be used.
How do I measure productivity for creative or knowledge workers?
Instead of pure output metrics, focus on impact and outcomes. This might include project milestones completed, client satisfaction scores, innovation metrics, or revenue generated from creative work. The >employee productivity report template should be tailored to capture valuable contributions, not just volume.

